How to debug with WebStorm in Docker TypeScript code
Using breakpoints in the debugging is very useful. It’s mainstream that developing Mobile Phone Applications or Desktop Applications with setting breakpoints in source code. Developing Web Applications use with too.
If developing with VS-Code or IDE of JetBrain, WebStorm, PhpStorm etc., we should use breakpoints in the debugging in most cases.
This article how to debug a TypeScript code in Docker container with WebStorm or PhpStorm.
Setting in WebStorm
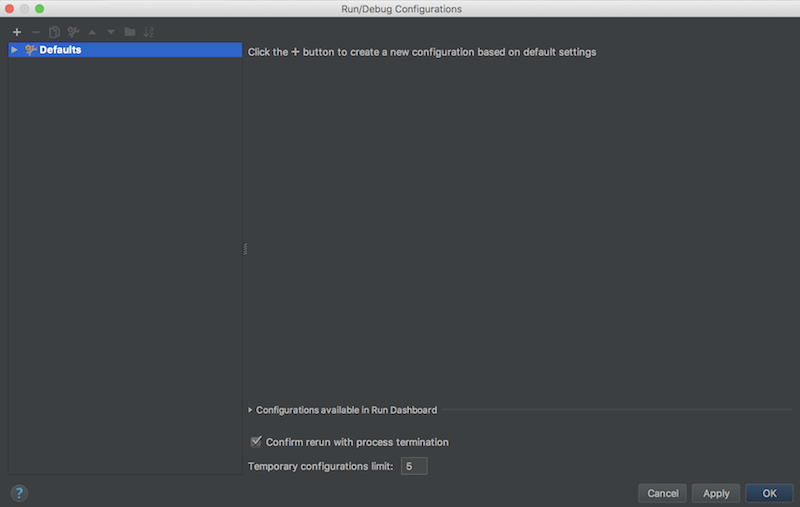
Open the following “Run" > “Edit Configurations".

Click upper left “+" and select “Attach to Node.js/Chrome" with the following.

- Name: a specific name
- Host: localhost
- Port: 9229
- Attach to: “Chrome or Node.js > 6.3 started with –inspect"
Click “OK" to save settings.
Debug command of ts-node(ts-node-dev)
It is necessary to run node with the flag –inspect for debugging. So add the following to package.json.
Case of ts-node
	{
		"scripts": {
		    // ...
		    "debug": "node --inspect=0.0.0.0:9229 --require ts-node/register src/index.ts",
		    // ...
		}
	}
case of ts-node-dev
	{
		"scripts": {
		    // ...
		    "debug": "ts-node-dev --inspect=0.0.0.0:9229 --respawn --transpileOnly src/index.ts",
		    // ...
		}
	}
“–inspect=0.0.0.0:9229" is option for Docker because IDE cannot attach to “localhost".
Breakpoints with Docker + ts
Run the debug command after launched Docker container.
# docker exec hoge npm run debug
Show the following messages.
Debugger listening on ws://0.0.0.0:9229/abced012-342a-47f9-b5603-7bcc54ae28fc
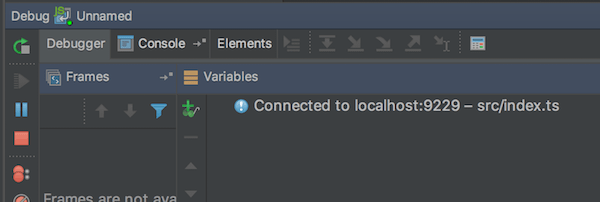
Click the debugging button in WebStorm, then IDE is attaching and into debug mode.

This is ready for debug with breakpoints. Check with web browser.
I tried to set debugging with WebStorm. It may be same way for PhpStorm and IntelliJ.


Discussion
New Comments
No comments yet. Be the first one!